
Demand Reach & Demand Coverage
Mention counts are vanity metrics — Demand Reach turns AI visibility into a business metric. Scout is the only AI brand tracker that pairs every prompt with real Google Keyword Planner search volumes, so you can size your reachable market and measure what you actually capture.
Demand Reach (dashboard hero strip)
The very first thing on your dashboard is the Demand Reach hero strip. It sums the monthly Google search volume of every keyword behind every prompt you're tracking — the total addressable market your AI visibility work is going after.
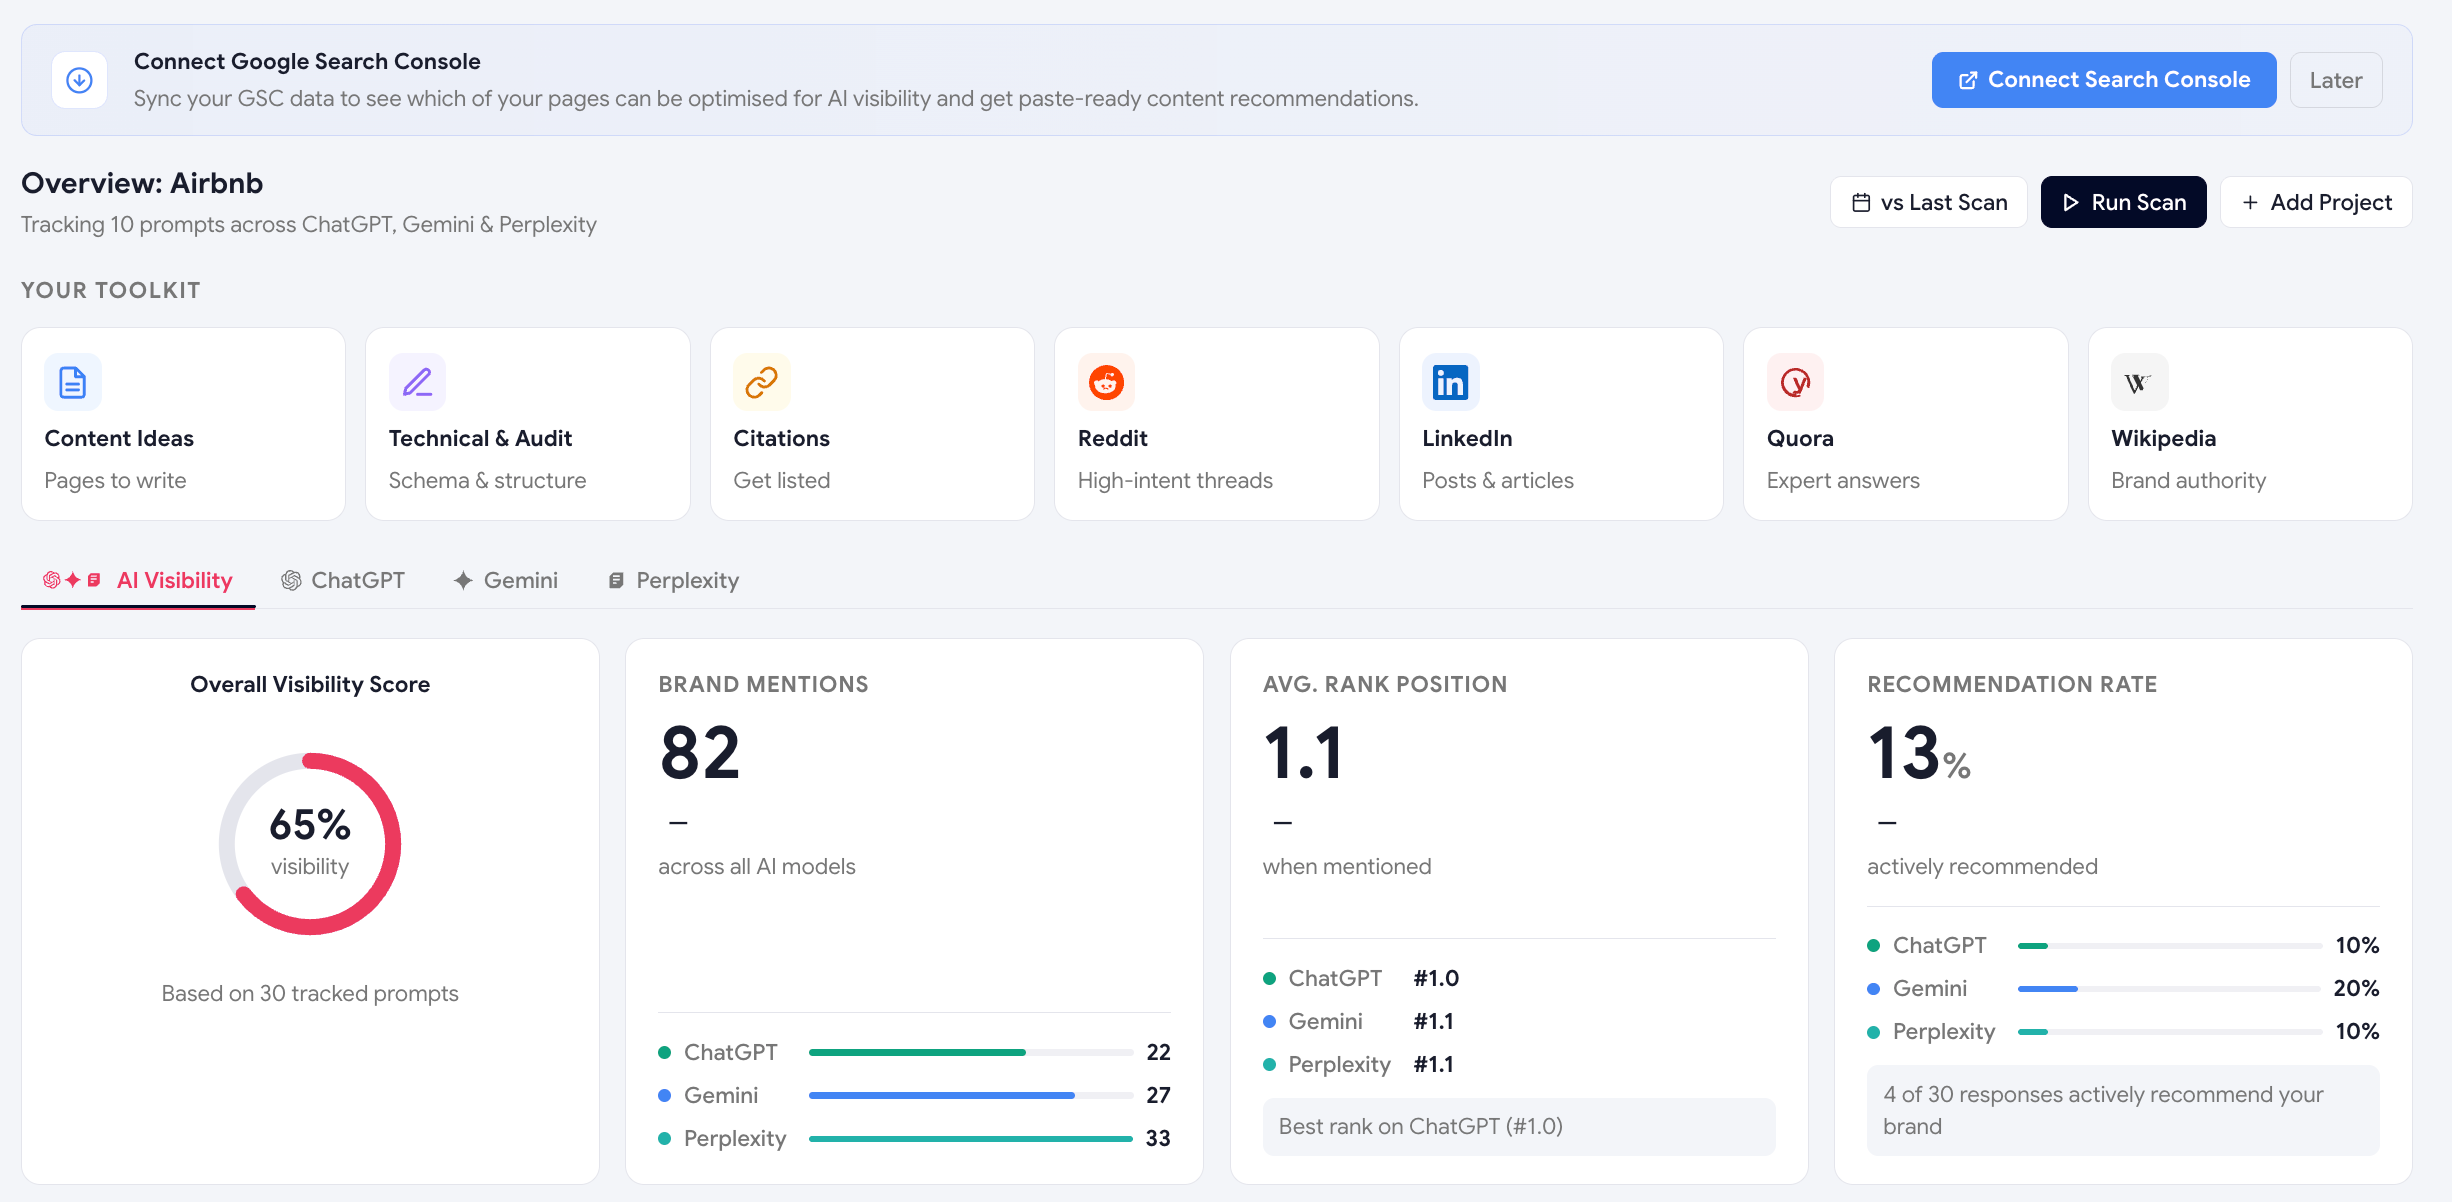
"We grew our share-of-voice on prompts representing 287K monthly searches" hits much harder than "we got 12 mentions this week." It's the same data, framed as a market opportunity instead of a vanity count.
How Demand Reach is calculated
- For each tracked prompt, Claude Haiku extracts 1–3 underlying core keywords in a specific→broad ladder (e.g., for "best CRM for a 10-person Indian startup": "crm for startups", "crm software india", "crm software").
- Scout looks up each keyword's monthly search volume via the DataForSEO Google Ads endpoint — same data as Google Keyword Planner.
- Volumes are summed per prompt as the total search volume.
- Volumes across all your tracked prompts roll up into the Demand Reach metric.
Long-tail prompts often have zero exact-match search volume, but the topic they cover does. The broad anchor keyword captures that demand so even niche prompts contribute a realistic signal to Demand Reach.
Demand Coverage (in reports)
Reports include a Demand Coverage module that goes one level deeper: how much of your reachable demand you actually capture today.
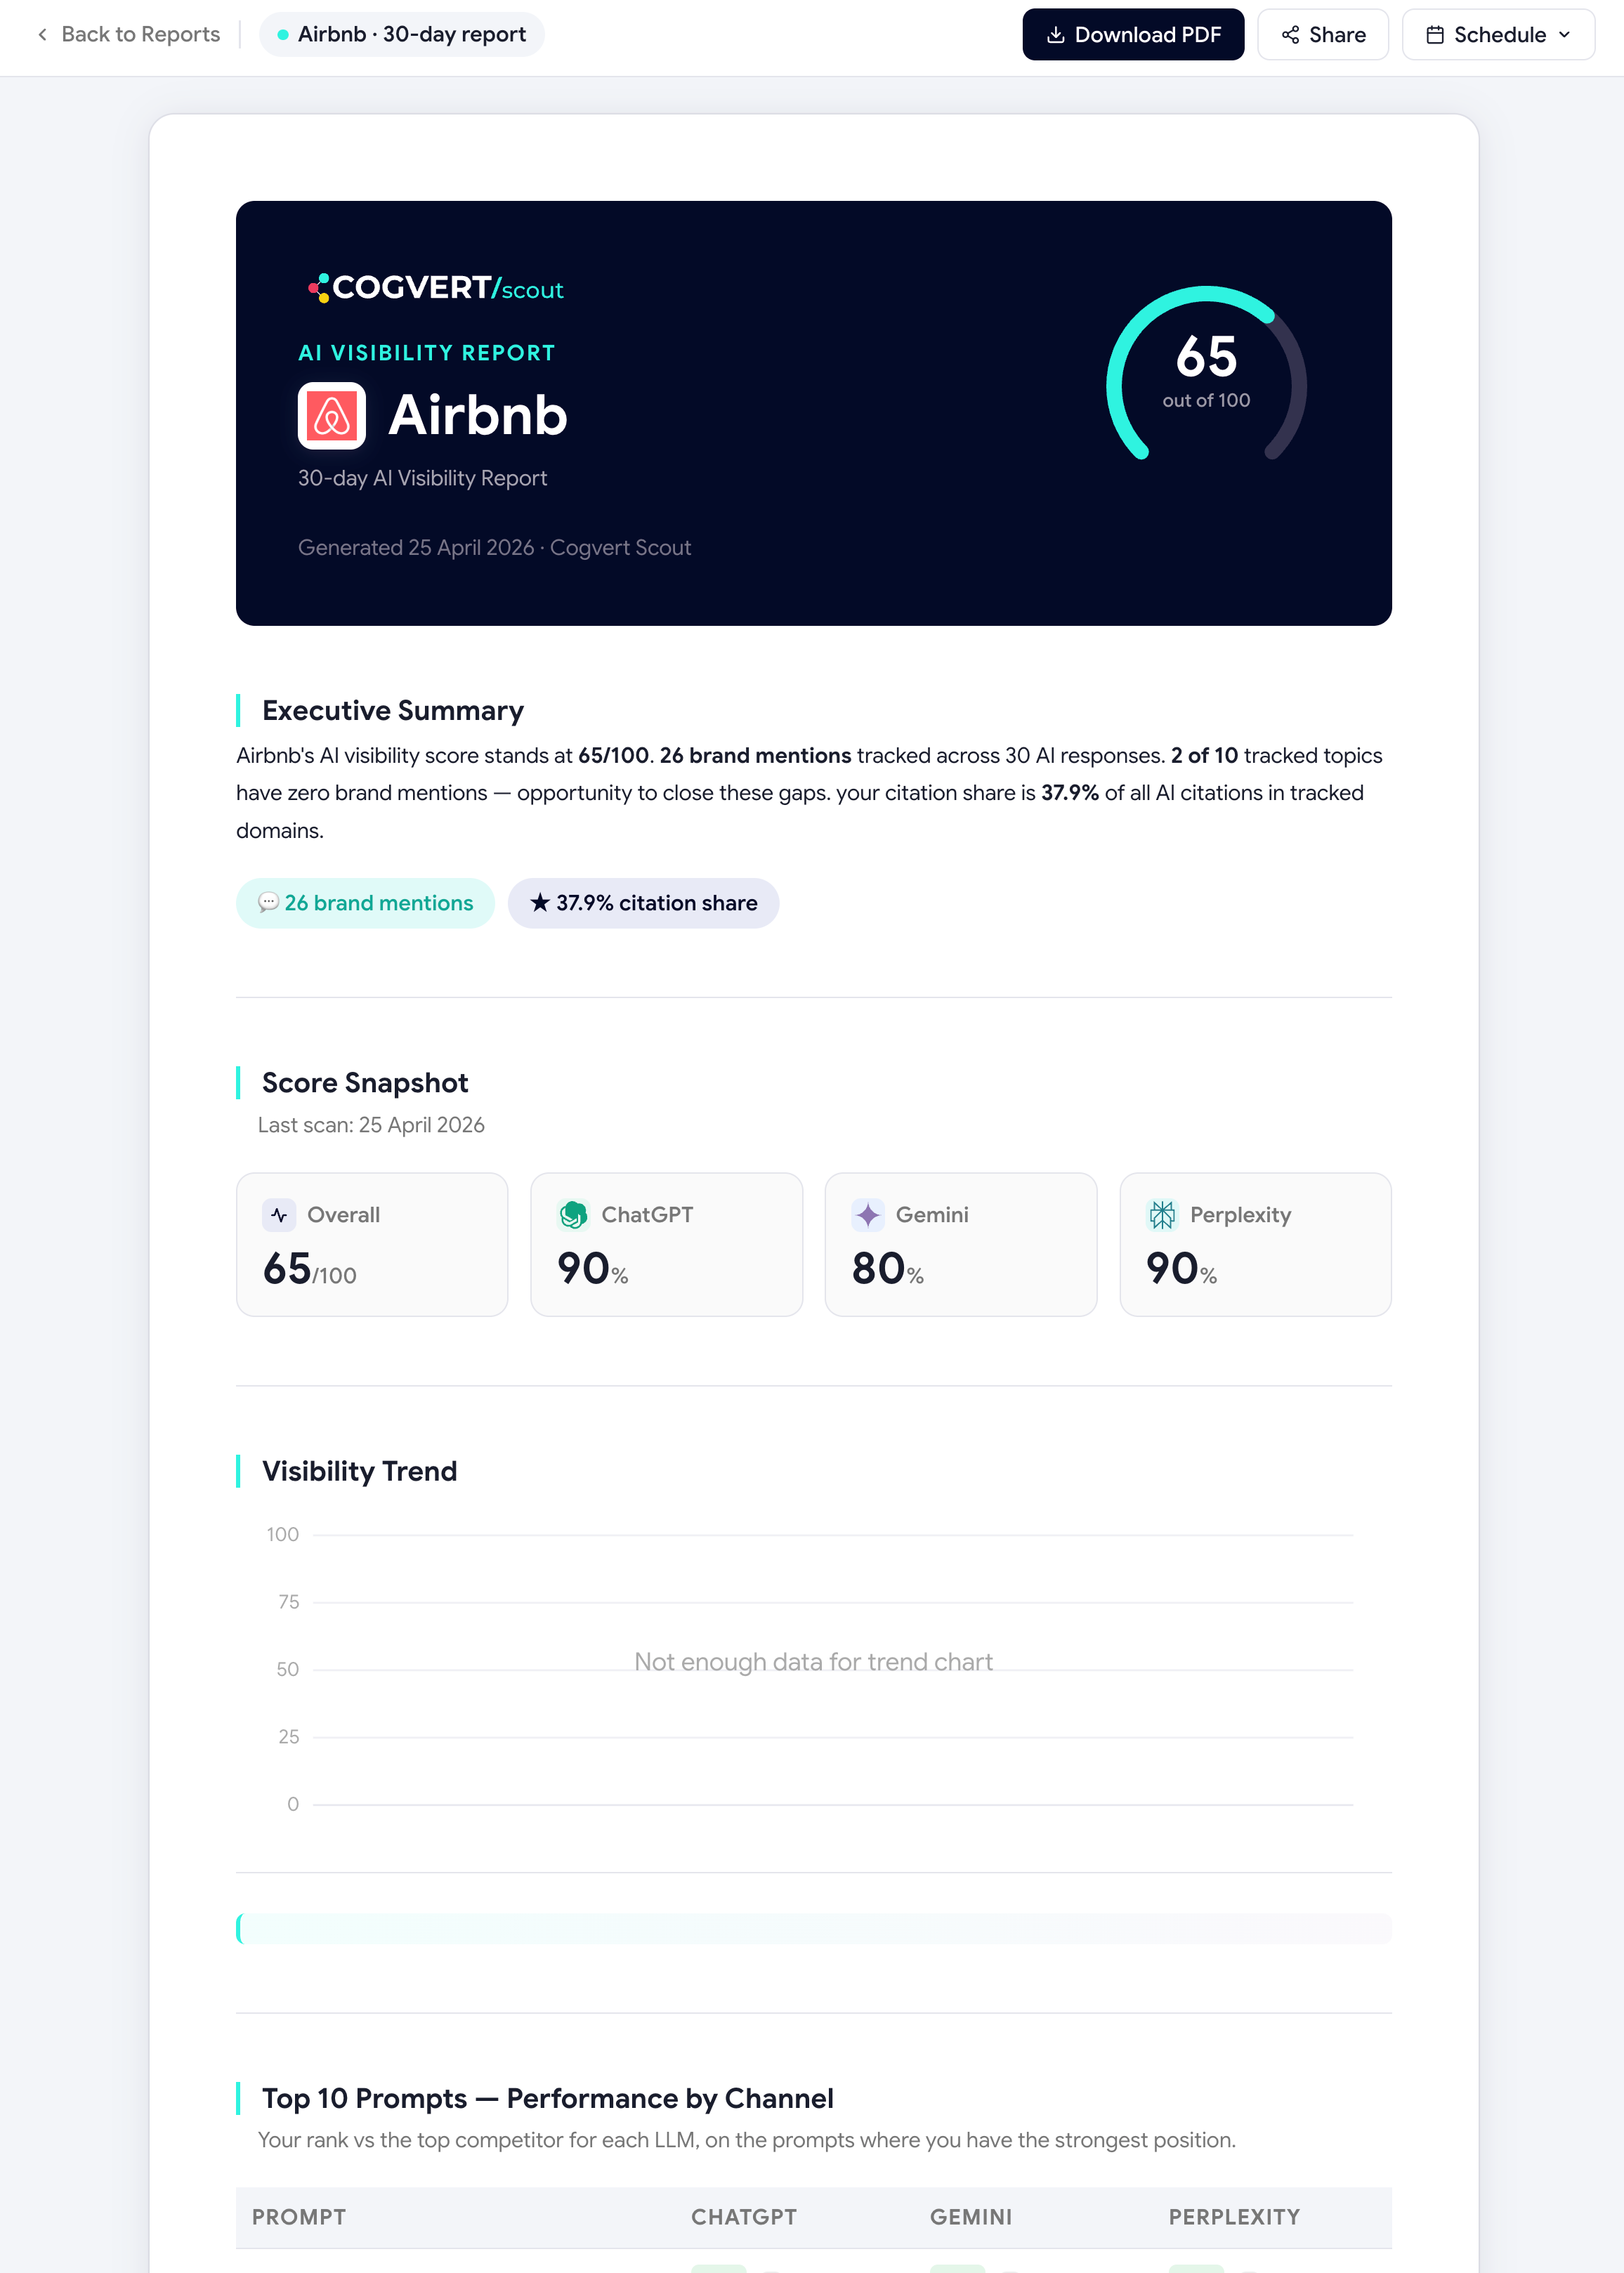
Three numbers that matter
| Metric | Means |
|---|---|
| Total demand reach | Sum of monthly searches across every tracked prompt — your reachable market. |
| Reached demand | Sum of monthly searches across prompts where you appear in at least one AI response. |
| Coverage % | Reached ÷ Total. Your share of the market currently captured by AI visibility. |
The two tables in the report
Below the three KPIs, the Demand Coverage module shows two side-by-side tables:
- Top 5 highest-demand promptsThe prompts with the most underlying search volume — these are the ones that move your business if you win them.
- Most expensive gapsHighest-demand prompts where you currently appear in zero AI responses. The single highest-leverage list in the entire app — every row is real money on the table.
The "Most expensive gaps" table tells you exactly which prompts to write content for, get cited on, or pitch into. Fix one per week and your Coverage % climbs measurably scan-over-scan.
Where demand data comes from
Search volumes are sourced from DataForSEO's Google Ads Keyword Planner endpoint. They're refreshed every 30 days per keyword (Keyword Planner updates monthly anyway). Volumes are localised to your brand's Country setting — change your country in Settings → Brand Profile if you want India-specific volumes vs US-specific.
See volume per prompt in Prompt Discovery →Was this page helpful?
Thanks for the feedback — we read every response.